In a nutshell:
- We're revamped the model evaluation process to make it easier to understand and use.
- The new dashboard simplifies model performance comparisons and customization of evaluation metrics.
- You can now easily dive deeper into your model's performance with dropdown options and health checks.
- The goal is to empower you to confidently assess your model's performance and make informed decisions.
- Pecan aims to demystify the predictive modeling process and provide a user-friendly experience for all.
"Good vibes only" – a phrase you've probably seen on T-shirts or posters. But in the world of machine learning, good vibes can quickly vanish when newcomers face unfamiliar jargon and confusing documentation.
At Pecan, we want your machine-learning journey to be full of good vibes. We believe in empowering you to create predictive models that tackle real business challenges – without the headache.
Most recently, we've set our sights on a crucial moment in your Pecan experience: the post-modeling phase. After successfully building your model, you should feel excited, not confused! That's why we've fine-tuned this stage so you can confidently assess your model's performance and make the right adjustments. Plus, understanding your model's capabilities is key to trusting its guidance for decision-making and strategy.
Based on invaluable user feedback, we've made a series of improvements. Let’s check out our most recent updates and see how they can help you learn about and improve your model — with only good vibes.
Better Understand Your Model’s Performance
When you love machine learning like we do at Pecan, you want everyone to see all the fascinating details about models. But for the busy data analyst or businessperson, that’s TMI.
To help you understand your model’s performance more quickly and easily, we’ve simplified the model dashboards into two main sections: How Good Is the Model? and Explore Your Model.
-

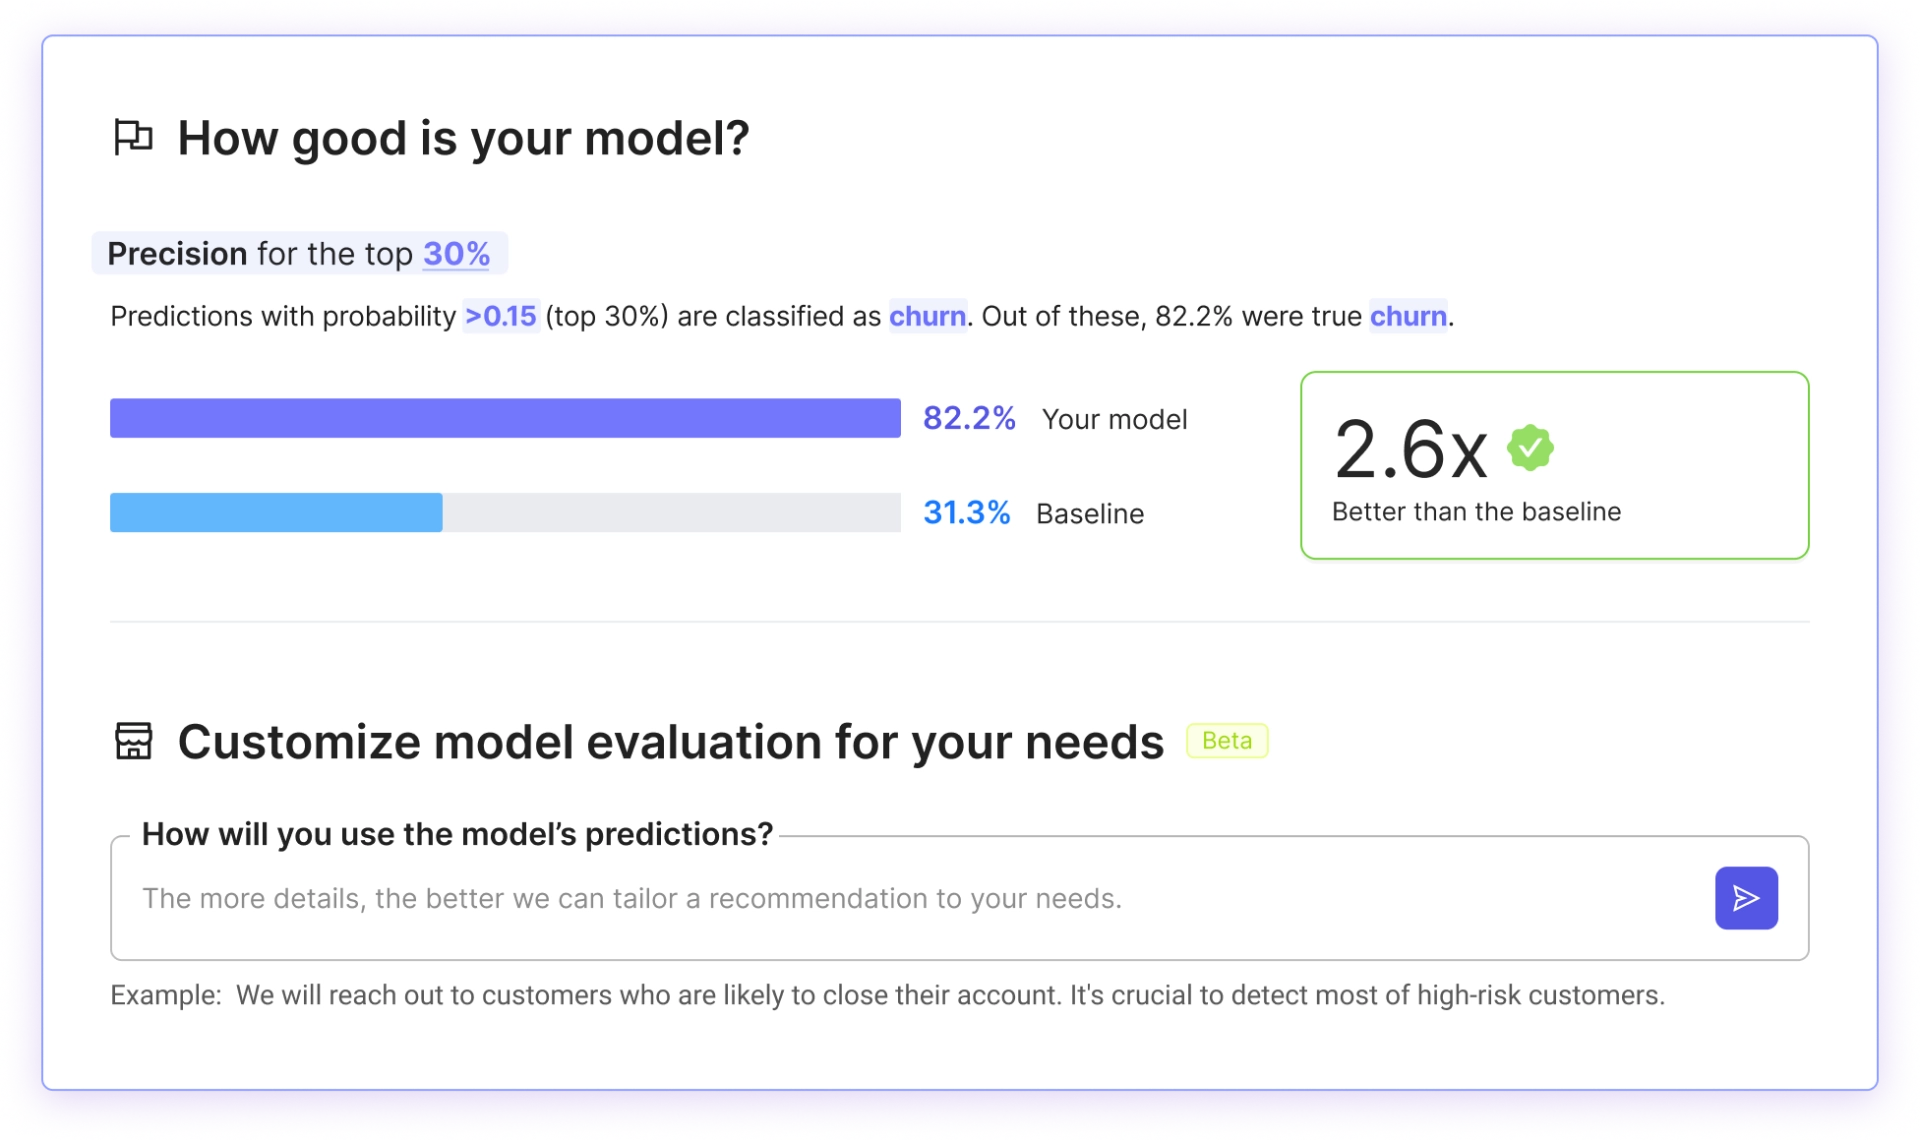
- The “How Good is Your Model?” section has a new look and an awesome new feature that helps you customize your model evaluation metric
In the How Good section, we’ve focused on comparing your model’s predictions to the outcomes of a “baseline” model, making it easier to understand how it performs. The baseline model essentially represents a random guess, without applying any particular logic, and it’s based on how frequently the outcome variable occurs in your actual data. Your predictive model is compared to the baseline to demonstrate the potential business outcomes of implementing complex logic, as opposed to relying on no logic at all.
But models don’t just have to perform well when compared to that baseline approach. They need to provide predictions that are useful for your specific business challenge.
That’s why we’ve introduced a new way to customize your model evaluation, based on how you plan to use the model’s predictions. You can simply type your intended use into a new AI-powered tool that will then recommend the right metric for evaluating your model.
Remember, choosing the right metric for evaluation is a critical decision for AI success. It focuses your efforts on how you will use the model’s outputs to achieve a specific business goal. Technical metrics often used in data science are interesting, but they may not reflect the actual potential of your model to change your business outcomes. The right metric will emphasize what’s important about your project, and will help set expectations about what the model can (or maybe can’t) do for your business.
Here are a couple of examples of how selecting the right metric can affect the business impact of a model:
- When building a churn model to send relatively expensive time-limited coupons to high-risk customers, precision is the key metric. It ensures accuracy in predicting churn, focusing on those most likely to churn and minimizing unnecessary coupon costs.
- When building a fraud detection model where catching every fraudulent transaction is crucial, even if it means reviewing some legitimate transactions, recall is the key metric. It ensures the model identifies the majority of fraudulent activities, even if it means flagging some non-fraudulent transactions, thereby maximizing our ability to prevent fraud.
Once you’ve entered your intended use of predictions and selected a metric, the visualizations about your model will all be customized for that metric.
Choosing the right metric for model evaluation can be confusing, especially for people new to predictive modeling. Additionally, with this new tool, you’ll be better equipped to explain the business impact of your predictive model internally in your organization, even to non-technical people. It’s just another way that Pecan helps users reduce the complexity of using predictive models and instead stay focused on solving business challenges.
Dive Deeper Into Your Model
There’s no shortage of additional information about your model’s performance, but we’ve reorganized how you experience it to make it easier to take in.
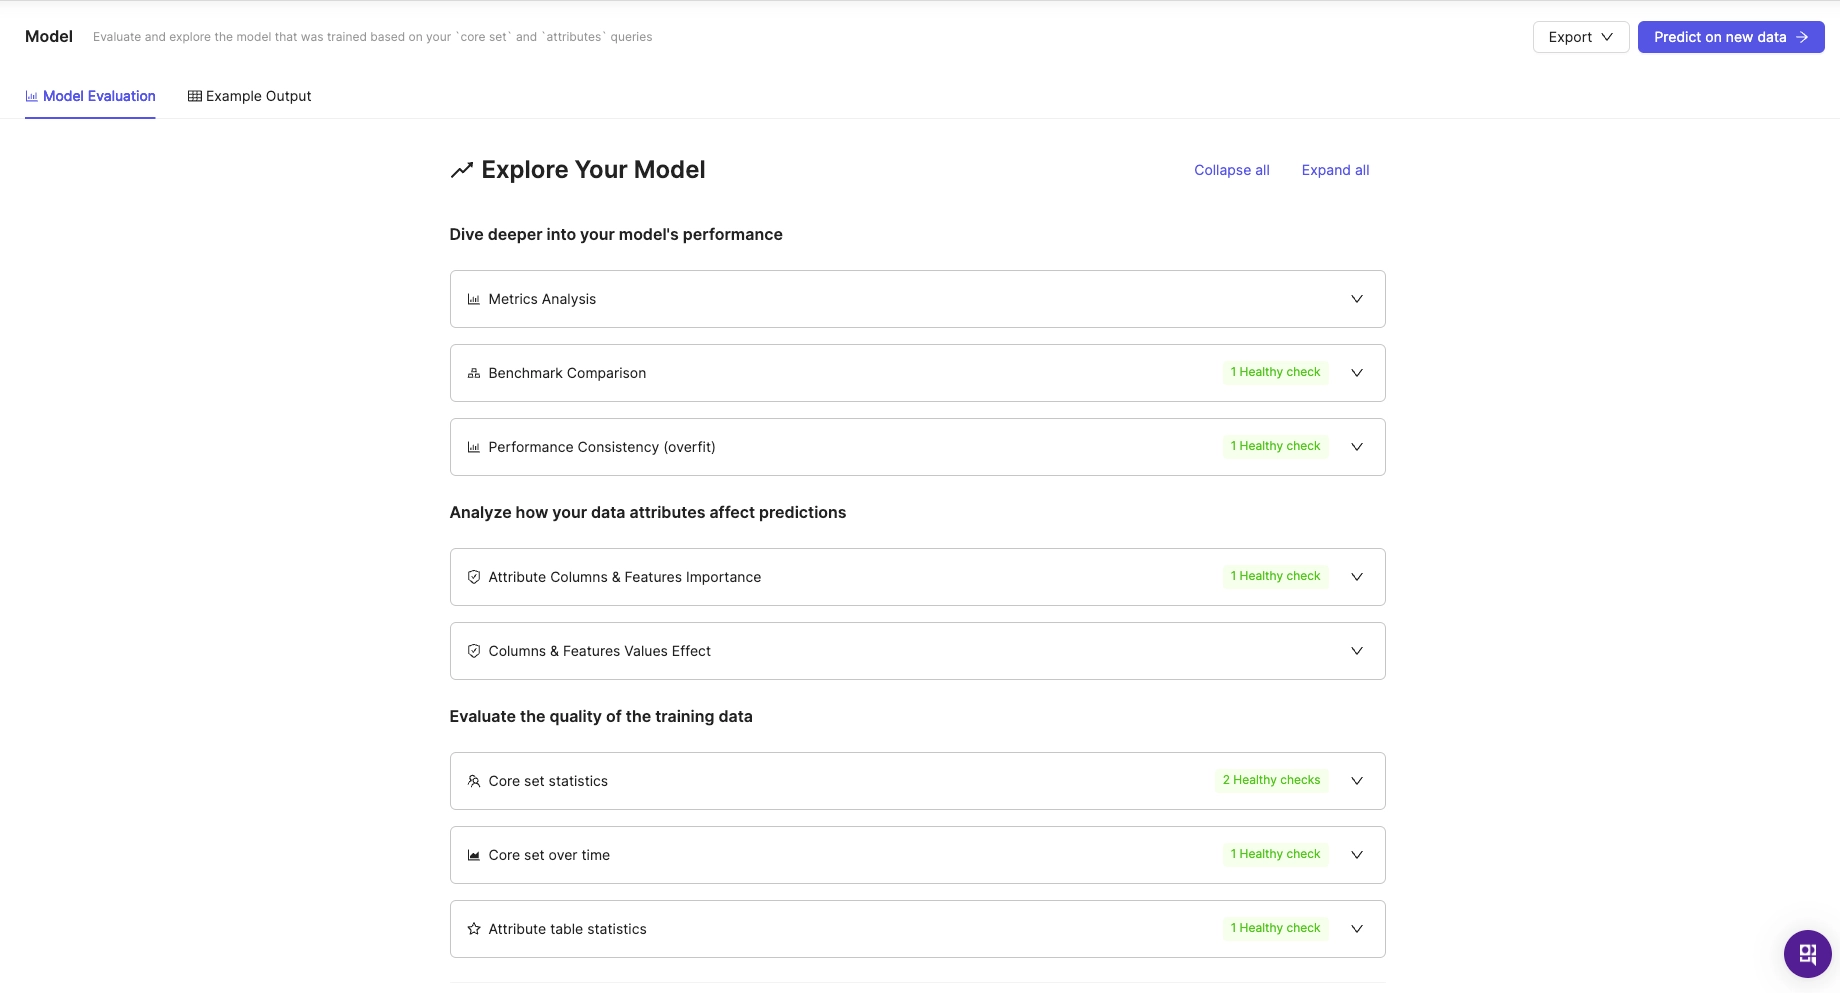
In the lower section of this dashboard, you’ll now find a series of dropdown options, each offering specific insights and tools. You can take a closer look at the metric you’ve selected, your model’s performance consistency (i.e., whether it’s overfitting), your attributes’ impact on predictions, plus your training data’s quality and characteristics.
We’ll also highlight with “health checks” any potential areas for improvement in your model or data. We check your model for overfitting, data stability, data relevancy, leakage, and more.
-

- “Explore Your Model” lets you dig deeper into important aspects of your model and its performance
Those are all super helpful details about your model and data, and we hope we’ve shared them with you in a way that’s easy to understand. For every section, you’ll have quick access to more context and help. That includes the interactive chat with our AI Assistant, who can offer explanations of what you’re seeing and suggestions for how you can take action on the information.
Predicting the Future, Minus the Mystery
We’re excited to see how you use this fresh design and these new tools! We’re always striving to better understand our users’ needs and demystify the predictive modeling process with our intuitive interface.
Let us know what you think, and enjoy modeling — with good vibes only!


